

Open-source uptime monitoring with a status page you own
4.8(6)21Development Tools
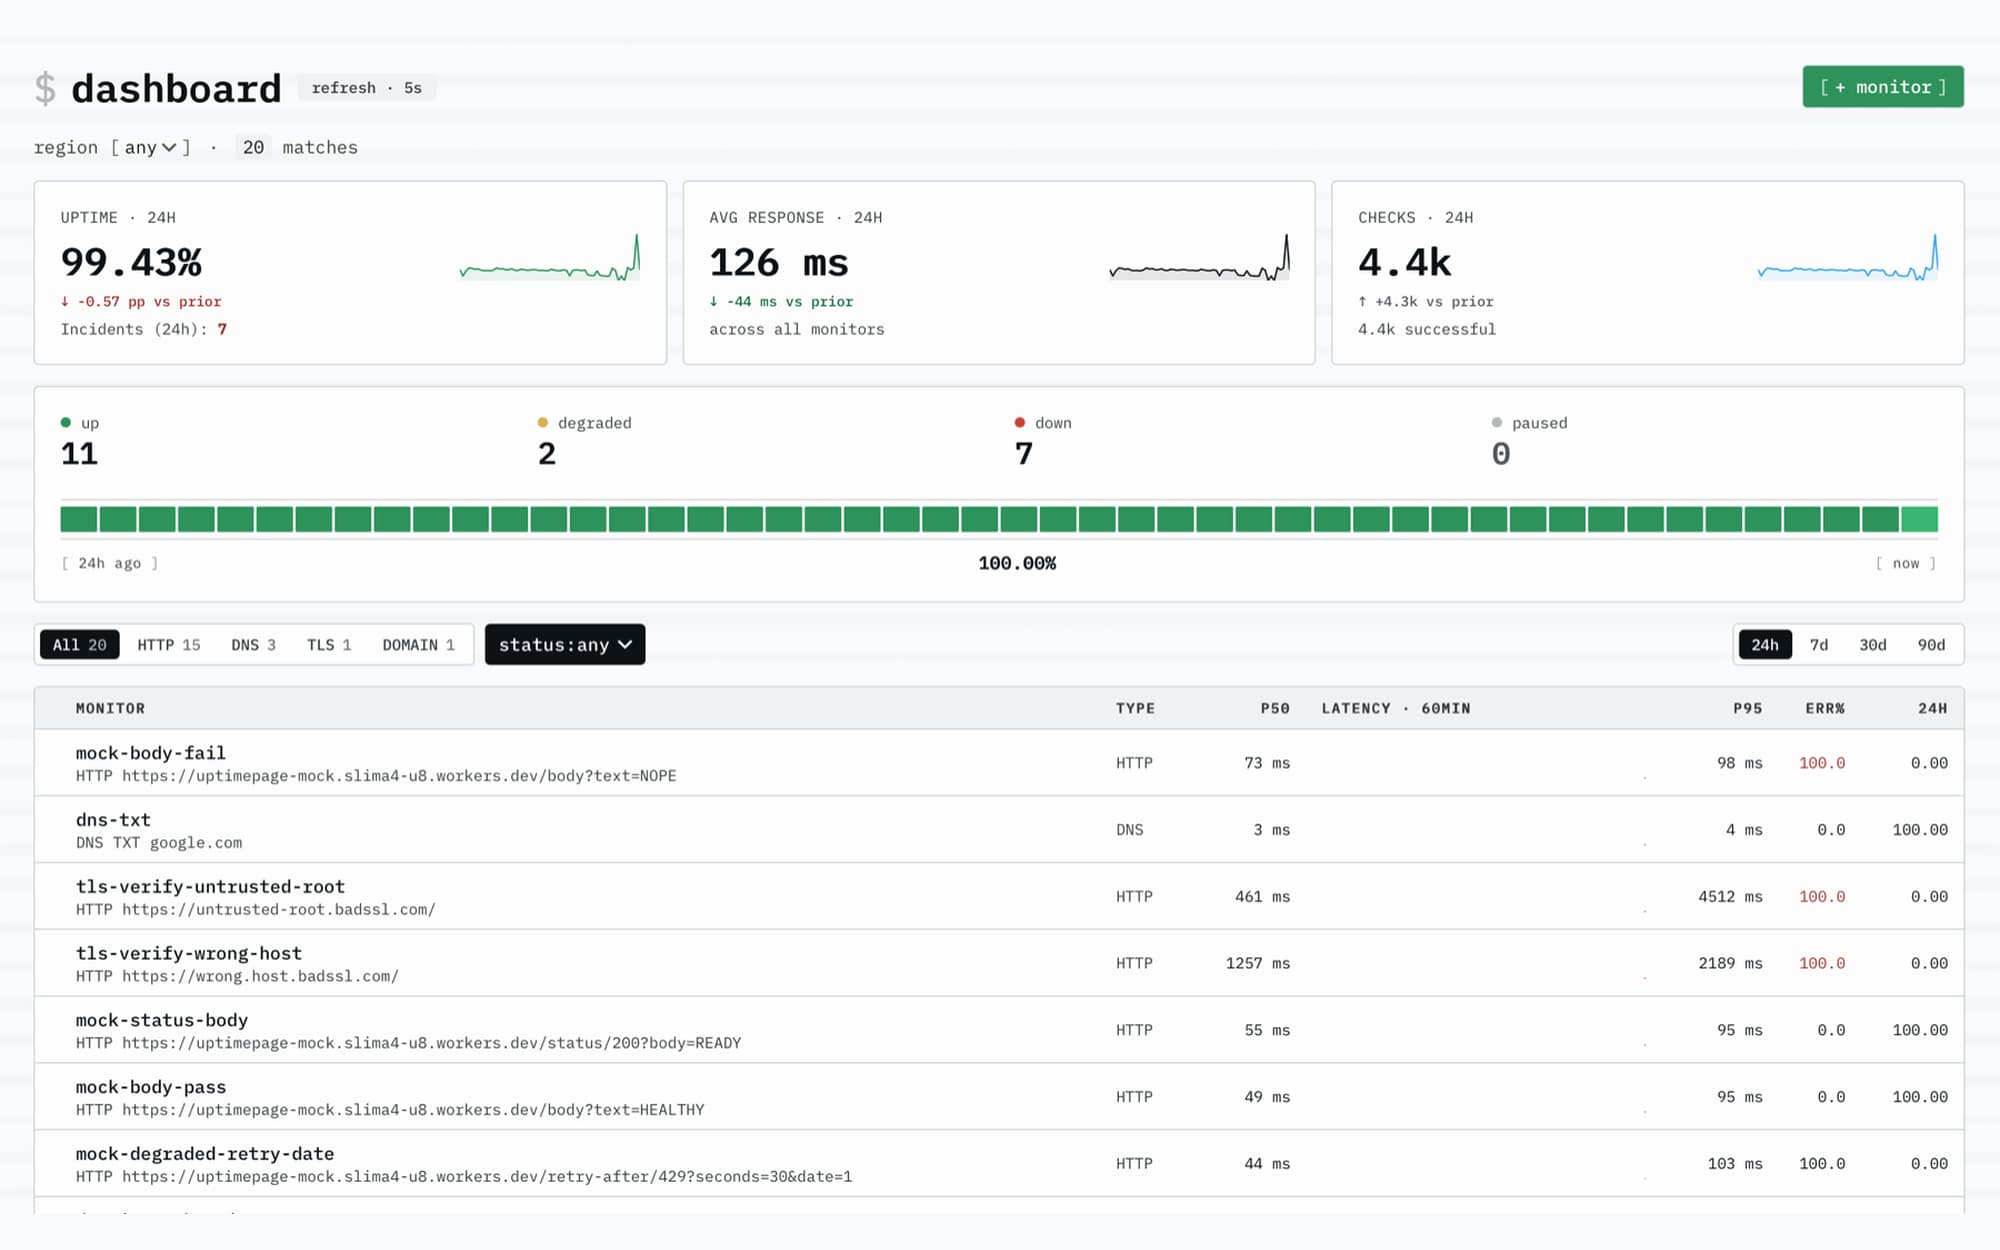
Uptimepage checks your websites and APIs every minute from several regions, alerts your team the second something breaks, and turns green and red into a polished public status page your customers can subscribe to.
Monitoring and the status page are one product, not two tools bolted together:
- HTTP, TCP, ICMP ping, cron heartbeats, DNS, TLS-cert and domain expiry, plus scripted browser login flows, from probes you can run in your own regions.
- Status page + incidents + alerting in one: components, subscribers, and paging that repeats until acknowledged. Email, webhook, Slack, Discord, Telegram, PagerDuty, ntfy, Pushover, SMS.
- Everything as code: REST API, scoped tokens, an official Terraform provider, and an MCP server your LLM can query.
- Own your probes and your data: self-host the single binary with docker compose, or use the hosted tier.
- Core is not paywalled: checks, status pages, subscribers, the API and every alert channel are free. AGPL if you would rather run it yourself.
Free hosted tier, no card. Live in about a minute.
6 ratings

AI video with native sound, paid per clip. Nothing stored.

A calmer Mac menu bar, one click away.

Enterprise Software. Intelligent Automation. Global Impact.


Comments
21Hi Fazier I built Uptimepage because every status page I tried was either a second tool to wire up next to my monitoring, or a hosted product that put the basics behind a paywall. So the whole thing is one product: the checks that go red are the same ones that drive your public status page, so the page can't lie about being up when it isn't. It's AGPL, the core is free (checks, status page, subscribers, API, every alert channel), and you can self-host the single binary or use the hosted tier. It's driveable by click, REST API, an official Terraform provider, and an MCP server, so you can manage monitors as code or ask an assistant about incidents. I'm doing a founding tier for the first users while we grow. Happy to answer anything, and I'd genuinely like to hear what your status page setup is missing today.
Chief Everything Officer
It's a great product with smooth pricing.
Thanks. Pricing was the part I rewrote the most. The rule I stuck to was that the things that make monitoring actually work, alert channels, the status page, the API, cannot sit behind a tier, because a monitor that cannot reach you is a decoration.
Data science
Uptimepage has great potential and offers some useful features, but I encountered a few issues that could be improved. Please contact me so I can share detailed feedback and suggest the changes I'd like to see. Email: [email protected]
Happy to hear it, and honestly the issues are the part I want. Easiest is [email protected], or open an issue on the GitHub repo if you would rather have it in public where other people can pile on. Either way, please include what you were trying to do when it went wrong, I will take specific complaints over polite ones.
The fact that the checks and public status page are driven by the same source of truth is compelling. For teams using the self-hosted binary, can incident updates be published through the REST API or Terraform as part of an existing incident workflow? That would make it easier to keep a human-written status update alongside the probe state.
Yes to the REST part, and it is the full lifecycle, not just a create call: declare an incident, post updates on it, acknowledge, assign, add internal notes, resolve, and publish or unpublish it to the status page separately from the internal record. Postmortems have their own endpoints too. It works the same on the self-hosted binary as on hosted, with scoped API tokens so a deploy pipeline can hold incidents:write and nothing else. The MCP server exposes post update, acknowledge and resolve as well, if you want that from an assistant. Terraform deliberately does not manage incidents. The provider covers monitors, notification channels, status pages and components, the things that should be declarative. An incident is runtime state with a lifetime of hours, and putting it in state files means a plan can try to delete your outage. So: config in Terraform, incidents through the API. Your human-written update sits alongside the probe state, which is the point.
i write a16z speedrun scout checks within 24hours | Co-Founder & CTO at Dial AI
The operational chaos problem Uptimepage solves is real for small teams. Usually you end up with Pingdom or Datadog for monitoring, then a separate status page tool, then manual Slack messages when things break - which means delays, context switching, and customers finding out about outages before the team. Having monitoring and the public status page tightly integrated into one product with unified alerting means the same incident that triggers a PagerDuty alert also automatically updates your customers, disables the incident, and pages the team until acknowledged. The everything-as-code angle (REST API, Terraform provider, MCP server) is especially smart for infrastructure teams - this becomes part of your IaC instead of another manual tool to babysit. The free core features also mean you're not trapped in a pricing tier just to get basic monitoring working.
Thanks for reading it that closely, you named the part that annoyed me into building this. The gap I kept hitting was the handoff: the monitor knows at 03:12, the customer finds out at 09:00 when someone remembers to update a page. Same source of truth removes that step entirely. On the paging side we have acknowledge, assign and internal notes today, with the internal timeline kept separate from what the public sees. On-call rotations are the next piece. And yes, the Terraform provider was selfish at first, I did not want to click 40 monitors into existence twice.
I like how this combines uptime monitoring with a built-in status page instead of requiring multiple services. The fact that you support multiple monitoring protocols and self-hosting makes it a solid option for developers who want more control over their infrastructure. I'm curious if there are plans to add historical uptime analytics or customizable incident reports.
Both exist already, so you can stop being curious. Historical uptime is queryable per monitor over any window up to 90 days per request, with the buckets scaling to the range. We keep raw results and minute rollups for 30 days and hourly rollups for 13 months on the paid tier, so the long view survives even after raw data ages out. One thing worth knowing: if a window has no checks in it, we report unknown rather than pretending it was 100%. For incident reports there is a postmortem on every incident with summary, root cause, impact and action items, and you choose whether to publish it on the public incident page. Action item owners stay internal. There is also a reports view over 7, 30 or 90 days with MTTA, MTTR, breakdown by severity, auto-resolved versus human-resolved, and which monitors are the noisiest. If you want a report shape we do not have, tell me, that is easier to add than to guess.
Really like that monitoring and the public status page share the same source of truth. The Terraform provider + MCP server angle is a nice touch too—teams can treat monitors as code instead of babysitting another dashboard. Curious how scripted browser login checks are priced or limited on the hosted tier?
Straight answer: they are not sold yet. The browser flow engine is in the product and traced end to end, but the per-plan cap is currently zero on every tier, so nobody can create one. I did not want to sell scripted logins before I was happy with how they behave under load, since a browser check costs a lot more to run than an HTTP check and a flapping login check is worse than none.
what a wonderful project, keep it up
Thank you, that helps more than you would think on launch day. Will do.
I am a full stack engineer mainly working as an Ai Engineer Remotely for a US based businesses.
I really like that monitoring and the status page are built into the same product instead of feeling like separate services stitched together. The setup seems straightforward, the range of monitoring options is impressive, and having so many alert channels available out of the box is a big plus. The fact that the core features are free and you can choose between hosted or self-hosted makes it easy to try without much commitment.
Thanks, that was the design goal. Not stitched together mostly because I got tired of stitching. Since you are full stack, the bit worth trying is pointing the Terraform provider or the REST API at it and defining a few monitors as code, it takes about the same time as clicking them and you get to delete them just as fast. If anything in the setup trips you up, tell me, first-run friction is the thing I most want to hear about.
The part I find most useful is that TLS-cert and domain expiry sit alongside the HTTP checks rather than being a separate reminder somewhere — expired certs and lapsed domains cause a surprising share of real outages and they are usually monitored by nobody. Question on the self-hosted side: when you run probes in your own regions, does the status page still have to be hosted by you, or can it point at a self-hosted probe fleet?
Your instance serves the status page itself. Path based at /status, or a subdomain per org if you point DNS at it, plus the public JSON API, RSS feed and badge, all from the same binary. Nothing calls home to us. Probes run in-process by default, and if you want more regions you deploy agents that pull their target list from your instance and push results back to it, with the token minted by your own admin endpoint. So the answer is the whole fleet and the page can be yours, not just the probes.
Transform your hairstyle instantly with AI. Upload a photo and see yourself with different haircuts, colors, and styles. Realistic previews powered by advanced machine learning.
Must be thoughtful, specific, and helpful.
The thing I'd want settled before pointing customers at a hosted status page: is the page served from the same infrastructure as the monitoring backend, or is it isolated and CDN-cached so it stays reachable when your own stack has a bad day? A status page that goes down with the thing it reports on is the classic failure mode. Related: can a self-hosted instance push into the hosted status page as a fallback? Leaving checks, subscribers and every alert channel outside the paywall is a rare choice, and it's the main reason I'd try this over monitoring plus a separate status page tool.