

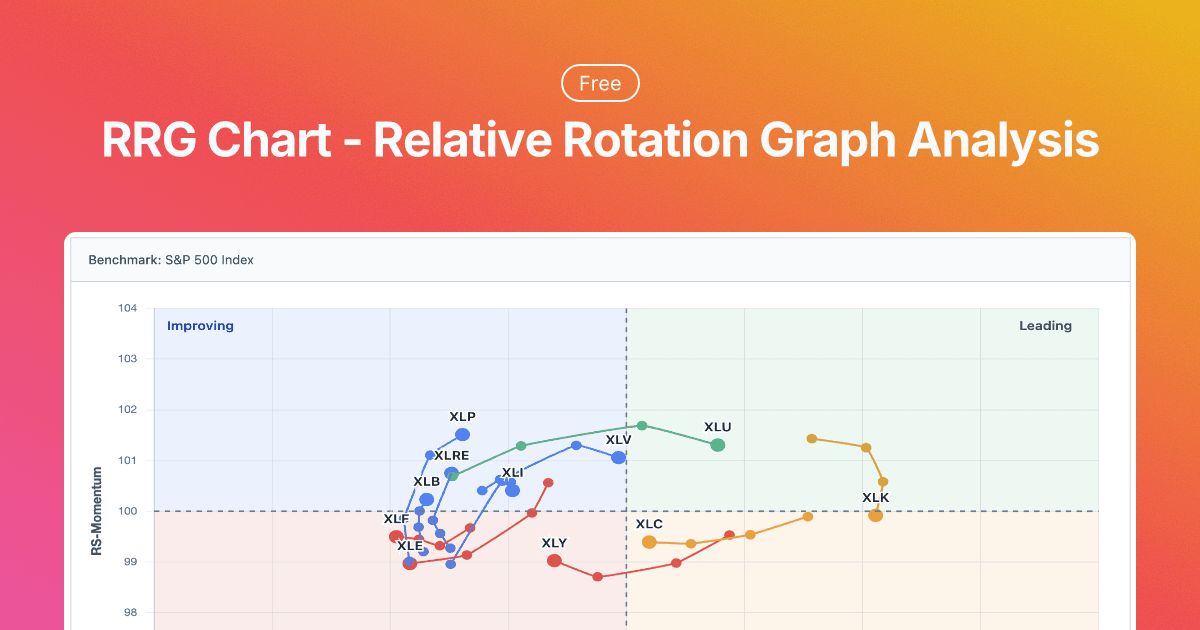
RRG Chart is a free, professional-grade Relative Rotation Graph analysis tool that democratizes advanced market rotation analysis for all investors. Unlike expensive institutional platforms, RRG Chart provides unlimited access to sector, industry, and commodity momentum tracking without subscription fees or usage limits. The platform features interactive RRG charts that visually identify which sectors are leading, weakening, lagging, or improving relative to market benchmarks, helping users spot market leadership shifts and rotation patterns in real-time.
Built with modern web technologies, RRG Chart offers a clean, professional interface optimized for financial workflows. The tool updates weekly with fresh market data and provides up to one year of historical data for comprehensive trend analysis and backtesting. Whether you're an individual trader analyzing sector momentum or a portfolio manager tracking market rotation dynamics, RRG Chart makes institutional-quality analysis tools accessible to everyone, completely free of charge.
35 people supporting this launch
4.8
6 ratings


AI video with native sound, paid per clip. Nothing stored.

A calmer Mac menu bar, one click away.

Enterprise Software. Intelligent Automation. Global Impact.


Comments
3We couldn't find any truly free RRG tools online, so we built one. Professional sector rotation analysis shouldn't be expensive - it should be accessible to every investor. No subscriptions, no limits, just clean charts that help you understand market momentum.
RRG Chart is a free, professional-grade tool that makes advanced market rotation analysis accessible to all investors. With interactive charts, real-time insights, and historical data, it’s perfect for traders and portfolio managers seeking institutional-quality analysis without the cost.
Male,68 yrs
How do you access RRG ?